
Etsy: 7% of Buyers, 40% of Sales, and a Warning That Arrives a Year Late
Why it matters: The habitual count is a 12-month rolling number, so it reports the damage late
HypothesisSlipping frequency is what turns habitual buyers into repeat buyers. Catching each buyer when their own rhythm breaks gives Etsy months to win them back, while they're still engaged.
In 30 seconds
- The company: Etsy, the marketplace for handmade and unique goods, with 86.5M active buyers in 2025.
- What Etsy already tracks: "habitual buyers," people who spend $200+ across 6+ purchase days in a year. They're 7% of buyers but about 40% of sales.
- What's missing: that number is counted over the past 12 months, so by the time it drops, the buyers started slipping up to a year earlier. Etsy says most didn't leave; they just bought a little less often.
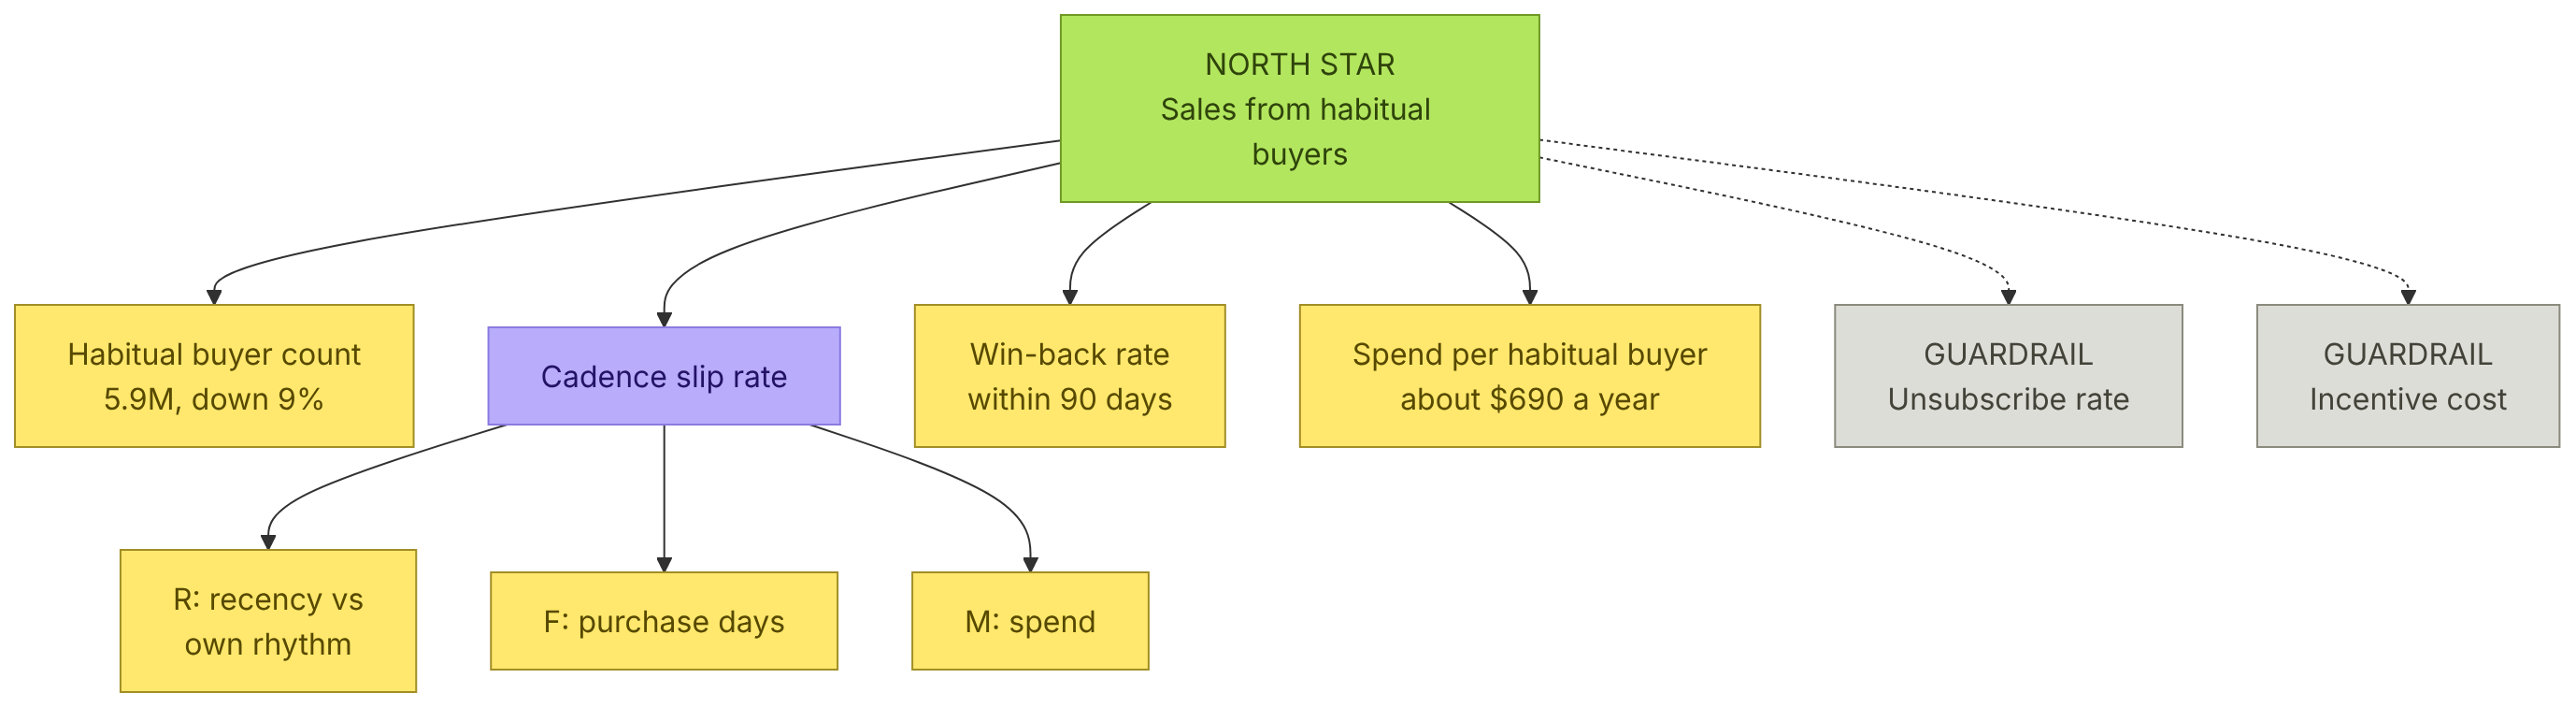
- My metric: cadence slip — habitual buyers whose gap since their last purchase is well past their own normal rhythm. It's the same signal, months earlier.
The thinking, drawn
3 diagrams

How I'd Test It
- Back-test it. Use last year's data: did cadence slip predict which habitual buyers fell to repeat, and how many months earlier?
- Act on it. For buyers who slip, send a personal reason to come back: a new item from a shop they've bought from twice, not a generic discount.
- A/B test for one quarter. Success means fewer habitual buyers sliding to repeat, with spend per active buyer holding.
The most important customer number is often already on the dashboard. The question is how late it tells you.
The full deep dive
For interviewers who want every detail and source.
What's Public (Etsy 2025 annual report)
| Buyer group | 2025 | Change |
|---|---|---|
| Active buyers | 86.5M | down 3% |
| New buyers | 21.2M | down 10% |
| Repeat buyers (non-habitual) | 34.6M | down 4% |
| Habitual buyers | 5.9M | down 9% |
| Spend per active buyer | $121 | down 0.5% |
Two more facts from the same report: habitual buyers mostly slid into the repeat group through slightly lower frequency or spend, rather than leaving. And reactivated buyers are worth about 40% more in their first year than brand-new buyers.
The Maths That Makes This Matter
If 7% of buyers produce 40% of sales, a habitual buyer spends about 5.7 times the average buyer, and about 9 times a non-habitual buyer. At $121 average spend, that's roughly $690 a year per habitual buyer. (My calculation from Etsy's rounded figures.)
So losing one habitual buyer to the repeat group costs about as much as losing nine ordinary buyers, and Etsy lost around 600,000 habitual buyers in 2025 alone.
Why It Could Be Wrong
Some buyers are seasonal: they buy heavily before holidays and then stop. For them, a long gap is normal. The metric has to compare each buyer to their own pattern from the year before, not to a fixed gap.
PM Deep Dive
Leading vs. lagging indicators
Etsy's habitual-buyer count is a trailing-twelve-month (TTM) metric. TTM numbers smooth out noise, which makes them good for reporting, but bad for acting, because they move slowly. A buyer who stops in January still counts as habitual until the next January. Cadence slip is designed to be the leading indicator that fires while the TTM count still looks healthy.
RFM: the framework underneath
Customer segmentation often uses RFM: recency (how recently someone bought), frequency (how often) and monetary value (how much). Etsy's habitual definition uses frequency and monetary value, 6+ purchase days and $200+. Cadence slip adds the missing piece, recency, measured against each buyer's own normal pattern rather than a fixed rule.
What's at stake, in revenue terms
- Etsy had about 6.5M habitual buyers in 2024 and 5.9M in 2025, so roughly 580,000 fewer.
- At about $690 of sales per habitual buyer a year, that's up to about $400M of sales tied to those buyers.
- Etsy's consolidated take rate (revenue divided by sales) was about 23% in early 2025. Applied to that figure, it's up to about $90M of revenue.
- This is an upper bound, my calculation from public figures. Most of these buyers moved to the repeat group and still buy something, so the real loss is the gap between their old and new spending.
Model, then experiment
- Back-test first: apply the cadence-slip rule to last year's data and measure precision (of flagged buyers, how many actually fell to repeat) and recall (of those who fell, how many were flagged in advance).
- Start simple: a rule based on each buyer's own average gap. Move to a churn-risk model only if the rule's precision is too low to act on.
- Target the persuadable: use uplift modelling to message buyers whose behaviour a nudge actually changes, not those who would return anyway. Discounts sent to people who'd have bought regardless are pure cost.
- Experiment: a randomised holdout among slipped buyers. Primary metric: share back to their own cadence within 90 days. Guardrails: unsubscribe rate and the cost of any incentive.